
What's Driving Orlando Home Prices in 2026?
Orlando home prices 2026 guide explaining housing inventory and qualified buyer demand in Central Florida.
The Real Force Behind Home Prices: Inventory, Demand, and What It Means in Orlando
Home-price headlines can feel contradictory. One report says prices are setting records, another says sellers are cutting asking prices, and a third says buyers have more negotiating room. All three can be true at the same time because housing is not one national market. It is a collection of local markets, neighborhoods, price ranges, and property types.
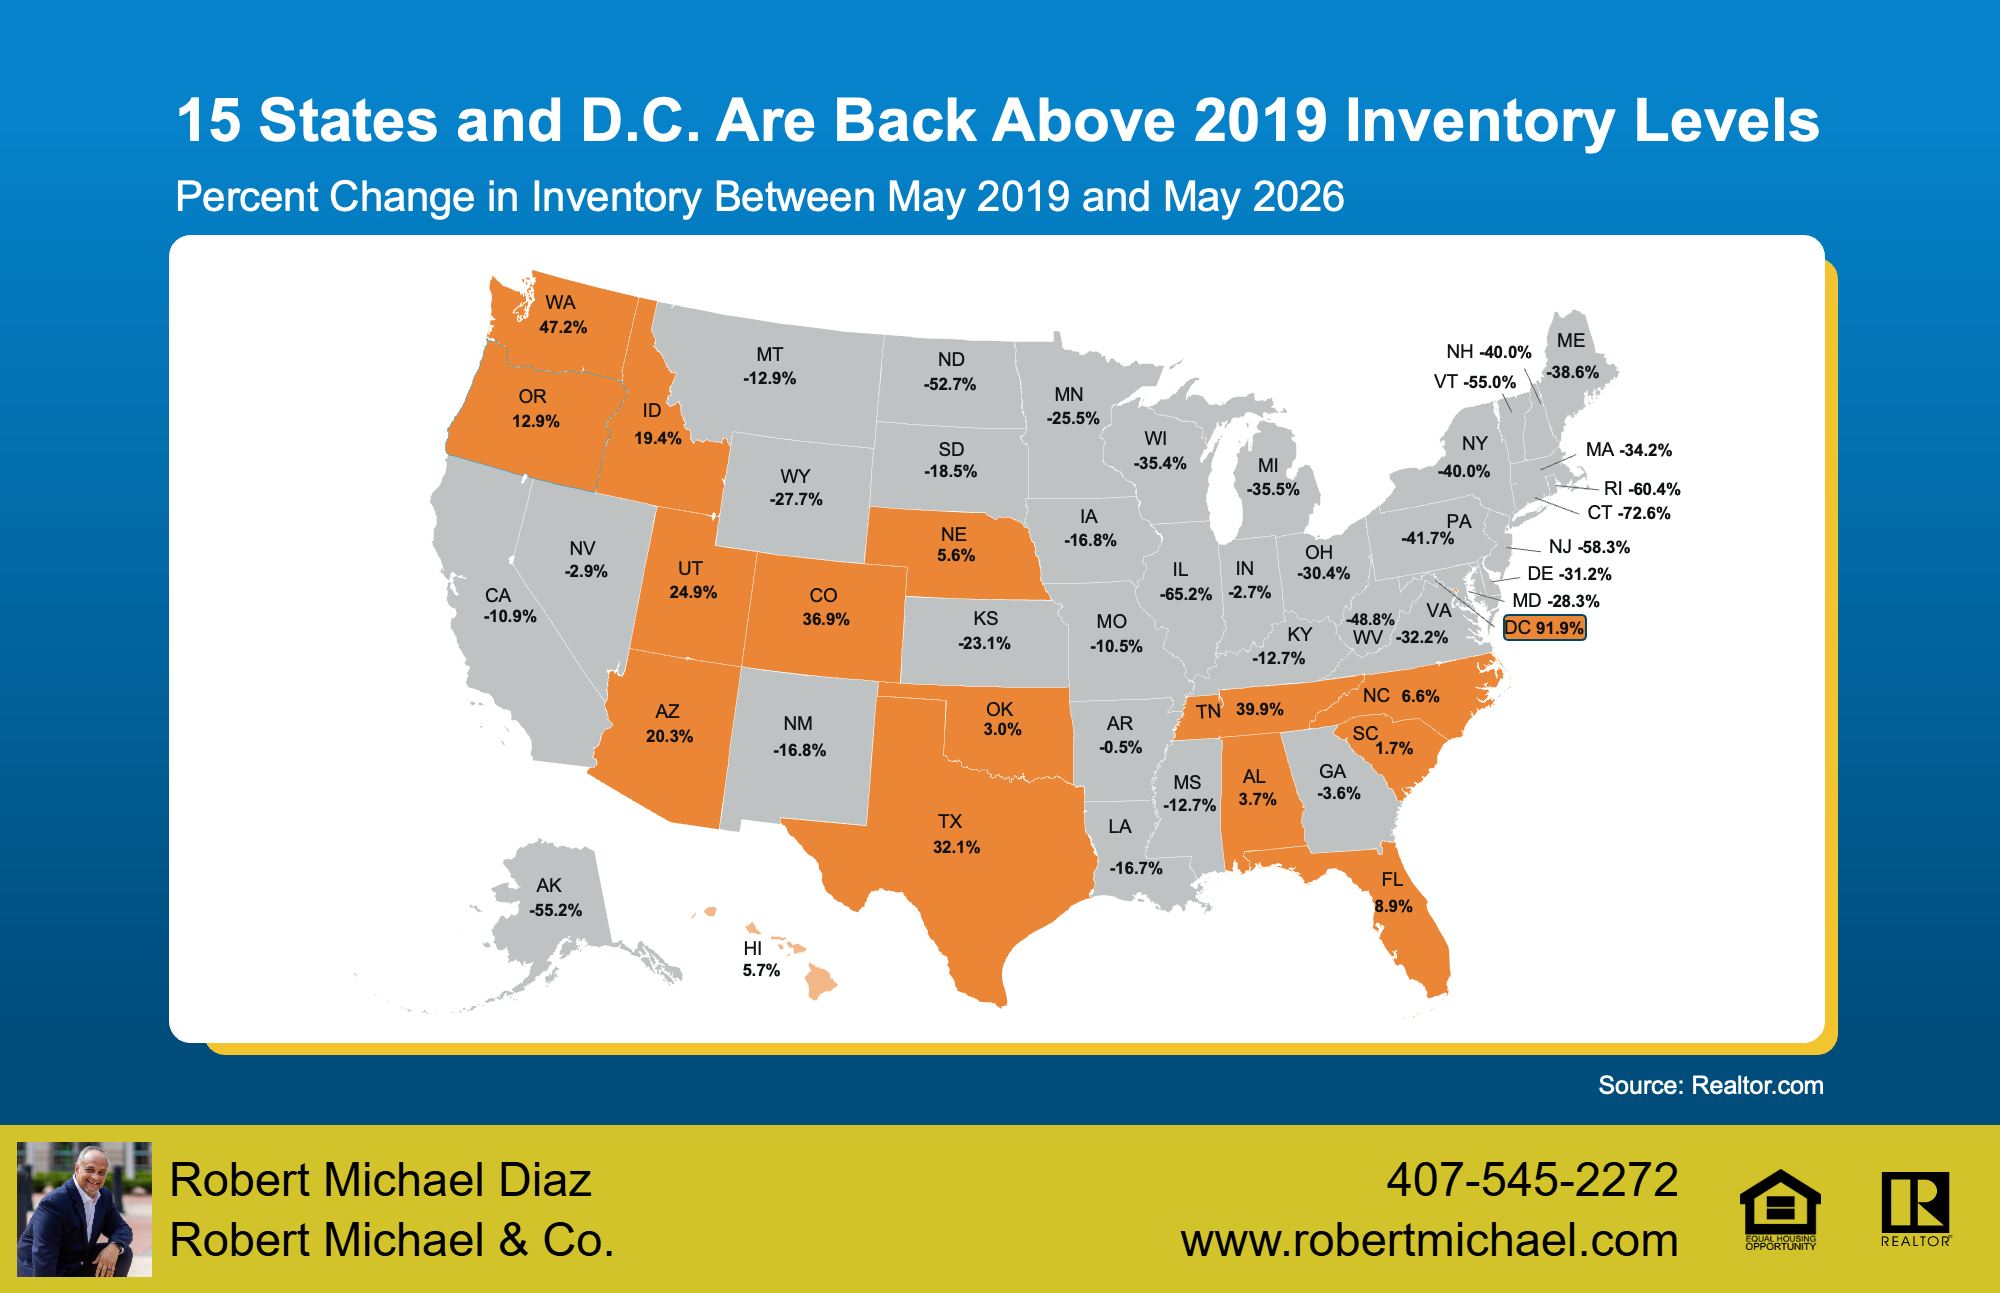
As Lance Lambert, CEO of ResiClub, explains, markets in parts of the Northeast and Midwest continue to record modest year-over-year home price gains because inventory remains below pre-pandemic norms. On the other hand, areas in states such as Texas, Florida, and Colorado, where the supply of homes has risen well above 2019 levels, are seeing prices level off or edge lower.
"Home prices are still climbing a little year-over-year in many regions where active inventory remains well below pre-pandemic 2019 levels, such as pockets of the Northeast and Midwest.
In contrast, some pockets in states like Texas, Florida, and Colorado — where active inventory exceeds pre-pandemic 2019 levels by a solid clip — are seeing modest home price pullbacks or flat pricing."
Data from Realtor.com shows that housing inventory has recovered beyond pre-pandemic levels in 15 states as well as Washington, D.C. In several of these markets, the number of homes available for sale now exceeds 2019 levels by a significant amount, as illustrated by the orange areas on the map below.
Next, let's compare those same states using the latest data from the Federal Housing Finance Agency (FHFA) to see how home values have changed over the past 12 months. As you review the following map, pay particular attention to the areas highlighted in orange.
The clearest way to understand what is happening is to watch the relationship between housing inventory and qualified buyer demand. Mortgage rates, employment, insurance costs, migration, new construction, and consumer confidence all matter, but they ultimately influence one side of that balance: how many homes are available and how many capable buyers are competing for them.
In Central Florida, that balance is creating a more selective, more negotiable market than the frenzy of the early 2020s. Well-priced, well-presented homes can still attract strong interest. Homes that are overpriced, need significant work, or carry uncertain ownership costs may sit longer. For buyers and sellers, the opportunity is not in reacting to a national headline. It is in understanding the supply-and-demand conditions surrounding a specific property.
What “Inventory” Really Means
Inventory is more than the number of active listings on a website. A useful market analysis looks at several layers:
Total active homes for sale.
Months of supply, which estimates how long it would take to sell the current inventory at the present sales pace.
New listings entering the market.
Pending sales and closed sales, which show the strength of demand.
Days on market and price reductions, which reveal whether buyers accept current pricing.
Inventory within the same neighborhood, price range, property type, condition, and school zone.
That last point is critical. A buyer looking for a move-in-ready three-bedroom home under a specific monthly payment does not view every listing as a substitute. A dated home with an older roof, high insurance costs, or a large homeowners association fee may not compete directly with a renovated home, even when both have the same bedroom count.
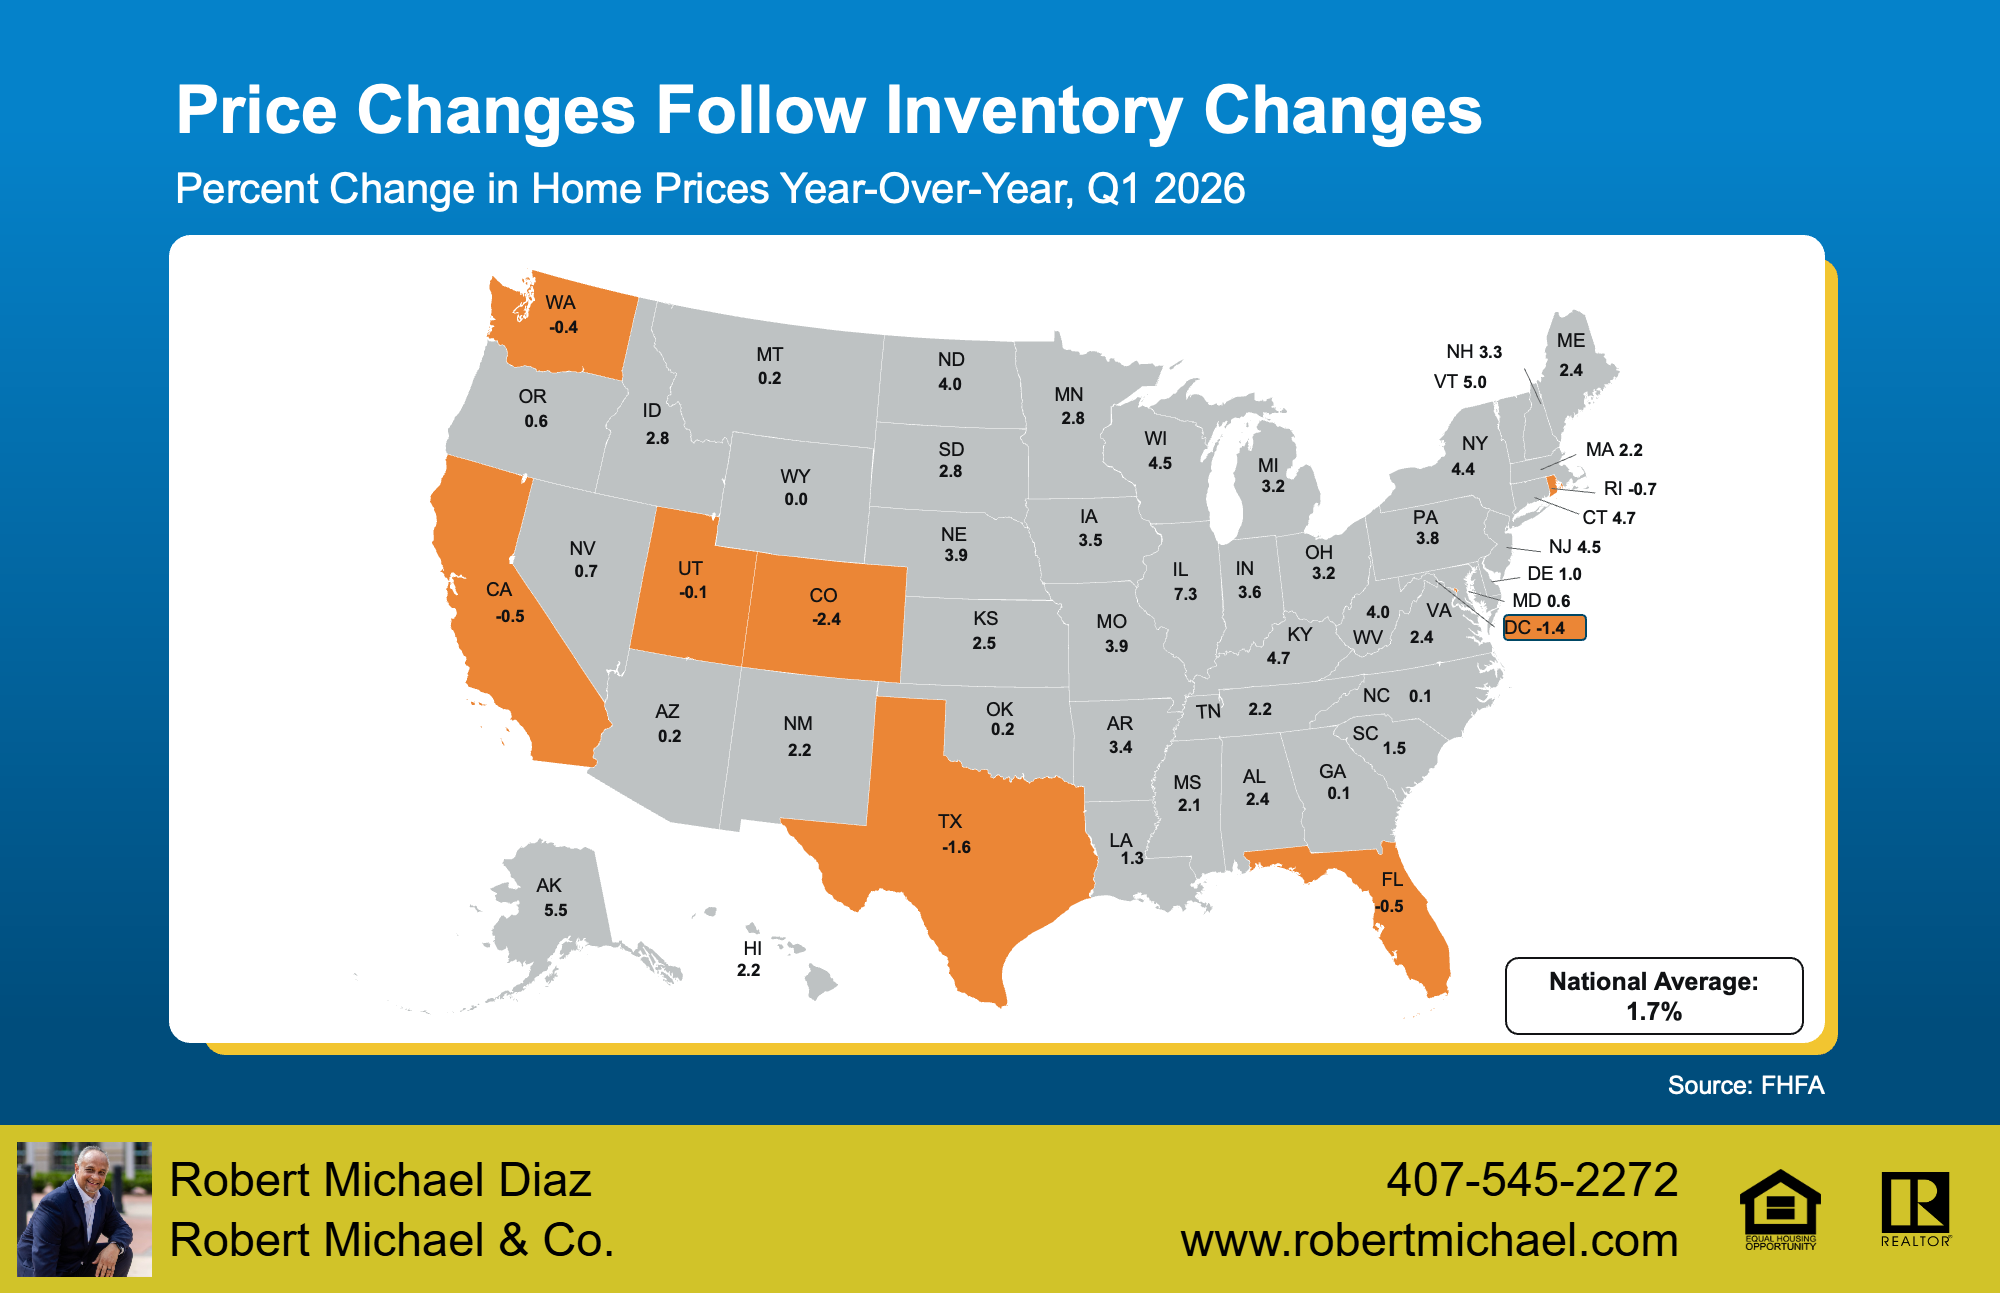
Although the national data shows home prices increased by an average of 1.7%, that single figure masks two distinct market trends. A small number of areas have experienced modest price declines, while most markets across the country continue to post annual home price gains.
This creates what can be called effective inventory: the homes that realistically meet a buyer’s budget, financing, condition, and location requirements. Effective inventory may be much tighter than the total listing count suggests. That is one reason desirable homes can receive multiple offers even in a market that appears balanced overall.
The 2026 Housing Market Snapshot
National data illustrates why the market feels mixed. In June 2026, the National Association of Realtors reported a median existing-home sales price of $440,600 and 4.6 months of inventory. Existing-home sales declined 2.4% from the prior month. At the same time, Realtor.com reported about 1.1 million active listings, up 1.9% from a year earlier but still below the typical 2017-2019 level. The national median listing price was $430,000, down 2.5% year over year.
Those numbers do not describe a single dramatic boom or crash. They describe a market that is gradually normalizing. Buyers have more choices than they did at the market’s tightest point, yet the country still has fewer listings than it typically carried before the pandemic. Sellers have less freedom to overprice, but limited supply can still support values in areas with steady demand.
Orlando’s June 2026 numbers reinforce the importance of local context. Realtor.com reported approximately 6,170 active listings, a median listing price of $384,900, a median sold price of $400,000, and a median 66 days on market. Homes sold for about 98% of asking price on average, and the Orlando market was classified as balanced. Active listings were lower than a year earlier but substantially higher than three years earlier.
That combination is a helpful lesson: a market can be more balanced than it was several years ago while becoming slightly tighter compared with the previous year. The direction and time frame of the comparison matter.
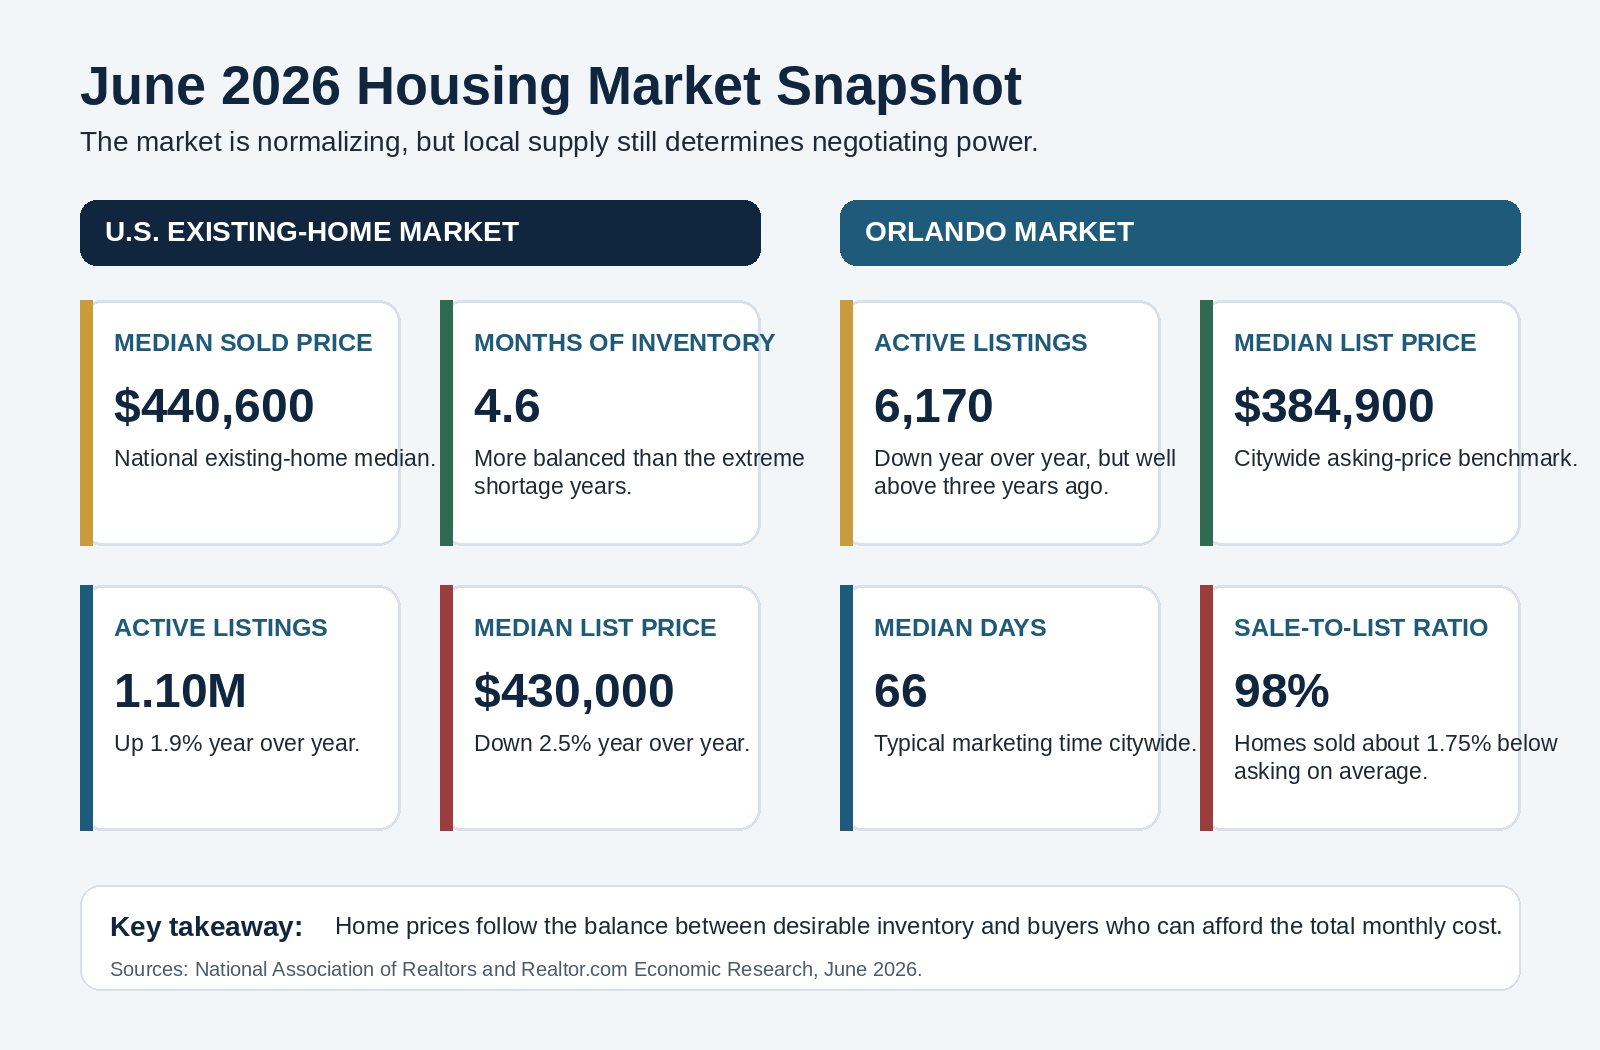
June 2026 national and Orlando housing market statistics for inventory, prices, days on market, and sale-to-list ratio.
Why Home Prices Move Differently by Neighborhood and Price Range
A citywide median cannot tell a homeowner exactly what a specific property is worth. Home prices respond to the competition closest to the property.
Entry-level homes may face strong demand because more buyers can afford them. Luxury properties may take longer to sell because the buyer pool is smaller. Condominiums may be affected by association reserves, inspections, monthly fees, insurance, and special assessments. New-construction communities can change nearby resale pricing through builder incentives, interest-rate promotions, and closing-cost assistance.
Condition also creates separate markets. A turnkey home with a newer roof, updated systems, strong curb appeal, and documented maintenance may sell quickly. A similar home that needs major repairs may require a discount large enough to compensate buyers for cost, inconvenience, financing limitations, and uncertainty.
For this reason, pricing a home by applying a citywide percentage to last year’s value is rarely reliable. A strong comparative market analysis should evaluate recent closed sales, current competition, pending activity when available, concessions, condition, lot features, insurance-related items, and the likely monthly payment for the target buyer.
How Buyer Demand Changes the Equation
Demand is not simply the number of people who would like to own a home. It is the number of buyers who are willing and financially able to purchase at current prices and monthly payments.
A small change in mortgage rates can alter purchasing power. Rising insurance premiums, property taxes, homeowners association fees, and maintenance costs can have the same effect. When monthly ownership costs rise, buyers may lower their target price, change neighborhoods, consider a different property type, or pause their search.
Demand can also shift quickly at the local level. A major employer, school preference, commute pattern, new road project, or popular community amenity can increase interest in one area while leaving another area less competitive. Seasonality matters too. Family schedules, school calendars, relocation timing, and weather can affect the number of active buyers.
This is why the best real estate decisions are based on live indicators, not broad predictions. Showing activity, online engagement, pending contracts, competing listings, and recent negotiations provide more useful information than a national forecast alone.
More Inventory Does Not Automatically Mean Falling Prices
It is tempting to assume that rising inventory must lead to a major price decline. The relationship is more nuanced.
If inventory increases because homeowners feel comfortable listing and buyer demand remains steady, the result may be slower price growth and more balanced negotiations. If inventory rises while demand falls sharply, prices may face stronger pressure. If new listings slow and buyer demand improves, competition can return quickly.
The quality of inventory matters as well. A market may have many listings, but if a large share is overpriced or needs substantial work, the best homes can remain scarce. Conversely, a wave of attractive new construction with meaningful incentives can create real competition for resale sellers.
The more useful question is not “Is inventory up?” It is “Is the supply of desirable, correctly priced homes growing faster than qualified demand in this exact segment?”
Seller Tips for a More Balanced Orlando Market

1. Price against today’s competition. Buyers compare your home with active listings and recent sales, not with the highest neighborhood sale from a different market cycle. An ambitious initial price can reduce early activity and eventually lead to a larger adjustment.
2. Win the first two weeks. The strongest attention usually comes when a listing is new. Complete repairs, declutter, improve curb appeal, prepare professional photography, and finalize the pricing strategy before launching.
3. Reduce buyer uncertainty. Gather roof information, permits, insurance details, utility history, homeowners association documents, warranties, and maintenance records. Clear documentation can make a home feel safer and easier to purchase.
4. Consider targeted concessions. A closing-cost credit or financing concession may improve a buyer’s monthly payment more effectively than an equal price reduction. The best approach depends on the buyer, loan program, appraisal, and seller goals.
5. Read the market’s response. Showings without offers, repeated objections, low online engagement, and stronger competing listings are useful feedback. A timely adjustment is usually more effective than waiting for the market to change.
Buyer Tips for Finding Value Without Missing the Right Home

1. Start with a payment-based approval. Ask a qualified lender to show how price, interest rate, taxes, insurance, association fees, and down payment affect the monthly total. This prevents wasted time and makes negotiations more confident.
2. Search by micro-market. Compare neighborhoods, ZIP codes, property types, and even different sections of the same community. A small location change may produce better value, lower fees, newer construction, or more negotiating room.
3. Use days on market strategically. A newly listed, accurately priced home may require a strong offer. A home that has been available longer may create room to discuss price, repairs, closing costs, or timing.
4. Investigate total ownership costs. In Florida, insurance, roof age, flood exposure, association finances, special assessments, and maintenance can materially affect affordability. A lower purchase price is not always the lower-cost home.
5. Negotiate the complete package. Price is only one term. Closing credits, repairs, rate buydowns, personal property, appraisal terms, inspection periods, and closing dates can all create value.
6. Do not wait for a perfect headline. Market conditions can improve in one way while becoming harder in another. Lower prices may attract more competition, and lower rates may increase demand. A sound purchase is based on personal readiness, a sustainable payment, appropriate inspections, and a property that meets long-term needs.
What Buyers and Sellers Should Watch Next
The most useful market indicators for the coming months are active inventory, new listings, pending sales, months of supply, median days on market, sale-to-list ratio, price-reduction activity, and seller concessions. These figures should be reviewed by neighborhood and price range whenever possible.
For sellers, rising days on market and frequent price reductions may signal the need for sharper positioning. For buyers, increasing inventory and longer marketing times may create leverage. If pending sales begin rising faster than new listings, negotiating conditions can tighten again.
The Bottom Line
The most important force behind home prices is the balance between the supply of homes and the demand from qualified buyers. Everything else—from mortgage rates and insurance costs to new construction and migration—feeds into that equation.
In the Orlando and Central Florida housing market, the current balance rewards preparation. Sellers need accurate pricing, strong presentation, and a strategy that reduces buyer uncertainty. Buyers need payment clarity, local market knowledge, and the ability to negotiate beyond the headline price.
Real estate conditions can change from one neighborhood, price band, and property type to the next. Before making a major decision, use current local data and property-specific analysis rather than relying on a national prediction.
Need a Property-Specific Market Analysis?
Robert Michael Diaz
Broker-Owner
Data Sources and Publishing Notes
Market statistics cited in this article were current as of June 2026. Because local real estate data changes frequently, refresh the figures before republishing the article at a later date.
· National Association of Realtors: Existing-Home Sales
· Realtor.com Economic Research: June 2026 Housing Market Report